How to Measure Social Media ROI: A Practical Guide
Learn how to measure social media ROI with clear goals, data collection, monetary values, ROI formulas, and optimization steps for small businesses.

Only27% of social‑media ROI metrics have published benchmarks. That means most marketers guess when they try to prove value. If you’re spending time and money on posts, you need a solid way to see the payoff.
In this guide we walk through five steps you can start today: set goals, pull data, give your results a dollar tag, run the ROI math, and then tweak your plan for better results. By the end you’ll have a repeatable process you can use on any platform.
Table of Contents
- Step 1: Define Clear Goals and KPI Benchmarks
- Step 2: Collect Data Across All Platforms
- Step 3: Assign Monetary Value to Your Outcomes
- Step 4: Apply the ROI Formula
- Step 5: Analyze Results and Optimize Campaigns
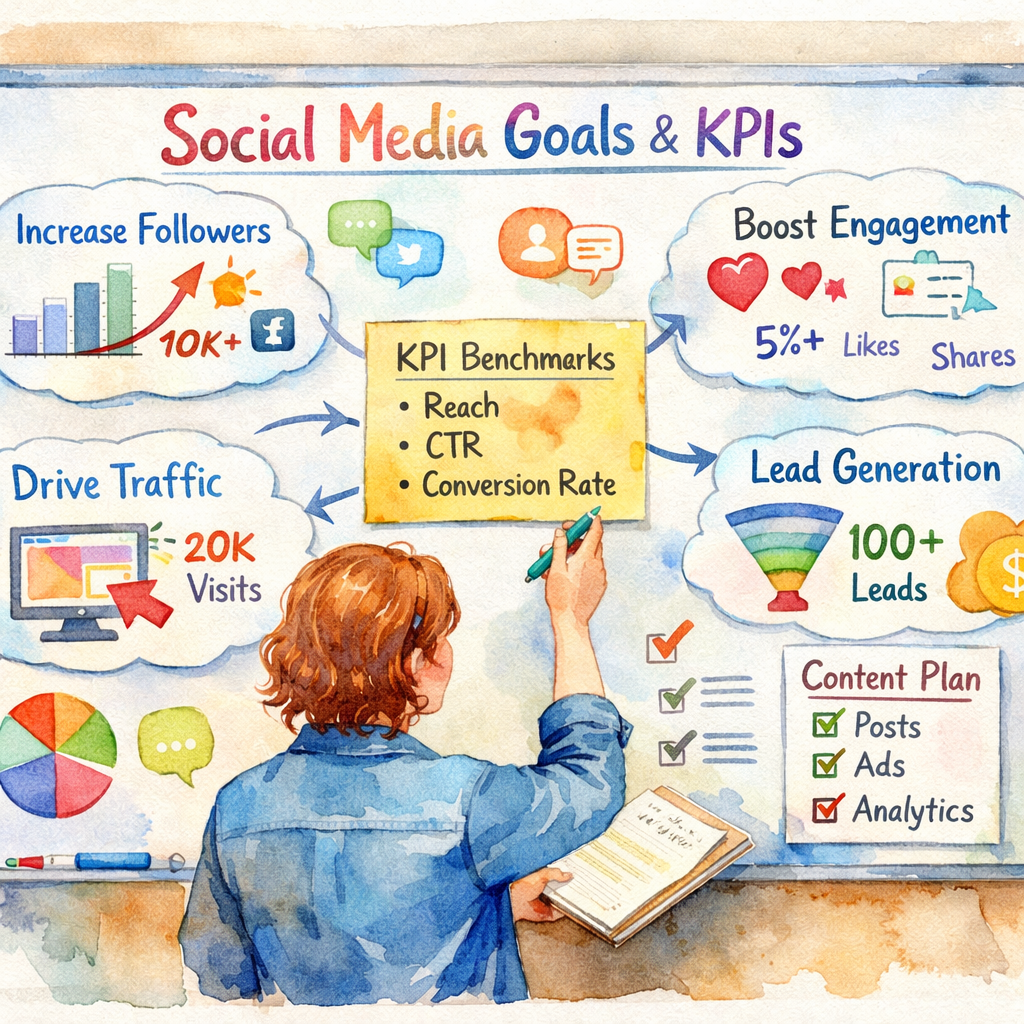
Step 1: Define Clear Goals and KPI Benchmarks
First thing you need is a goal that you can measure. Vague aims like "grow brand" don’t help a spreadsheet. Instead pick something specific: "generate 150 leads from Instagram in Q3" or "boost website sales by 10% from TikTok ads".
Why does this matter? When you have a clear target, every metric you track can be tied back to it. That turns vanity numbers into business‑focused data.
To pick the right KPIs, group them into three buckets:
- Awareness : reach, impressions, share of voice.
- Engagement : clicks, comments, reply rate (SocialLead gives a 15‑35% benchmark).
- Conversion : leads, sales, customer acquisition cost.
Match each bucket to your goal. If your goal is lead gen, focus on the conversion bucket. If you’re building brand, look at awareness and engagement.
27%of social‑media ROI metrics have benchmarks
For a real‑world feel, check out how a fashion brand set a 12% sales lift target on Instagram and then tracked that lift using the conversion KPI. They compared the lift to a baseline period and could prove the spend paid off.
When you choose KPIs, look for industry standards. Wikipedia’s ROI page explains that a good benchmark is a positive percent, anything above 0% means you earned more than you spent.
Pro tip: Write your goal and KPIs on a single sheet and hang it near your desk. Seeing them daily keeps the team aligned.
Pro Tip: Use SocialLead’s reply‑rate benchmark (15‑35%) as a quick sanity check for engagement health.
Now you have a goal, a set of KPIs, and a benchmark to aim for.
Imagine you’re a solo creator. Your goal: 200 newsletter sign‑ups from YouTube in the next month. Your KPIs: video view‑through rate, link clicks, and sign‑up conversions.
Bottom line: Clear, specific goals paired with the right KPI buckets turn fuzzy ideas into measurable targets.
Step 2: Collect Data Across All Platforms
Once goals are set, you need the data to feed your calculations. Data lives in many places: native platform dashboards, Google Analytics, and your CRM. Pull it together in one spot so you can compare apples to apples.
Start with UTM parameters. Add?utm_source=instagram&utm_medium=social&utm_campaign=leadgen_q3to every link you share. This tags traffic so Google Analytics can tell you which clicks came from which post.
Next, pull platform‑specific numbers. Instagram gives you impressions and profile clicks. TikTok shows video views and click‑throughs. LinkedIn reports lead gen form submissions. Export each report as CSV.
Don’t forget paid spend. Your ad platform (Meta Ads, Google Ads, or LinkedIn Campaign Manager) provides cost per click, total spend, and conversion data. Record these numbers in the same sheet as organic metrics.
To avoid manual headaches, consider a data‑unification tool. SocialLead’s free calculators let you combine UTM‑tagged traffic with ad spend in a single dashboard.
Pro tip: Set up a weekly automation that pulls the latest CSVs into Google Sheets via API. You’ll always have fresh data without copying files.
Pro Tip: Schedule a recurring import of platform reports using SocialLead’s API to keep your data current.
When you have all the numbers in one place, you can start mapping revenue to each channel.
Stat Highlight:
30%of marketers miss hidden costs like staff time
Bottom line: Centralizing raw data from every channel gives you a single source of truth for ROI calculations.
Step 3: Assign Monetary Value to Your Outcomes
Now that you have clicks and leads, you need to put a dollar amount on them. Not every action has a direct price tag, but you can estimate value using two methods.
Method 1: Revenue Attribution. Track the first sale that came from a social click. If a $120 purchase followed a link, assign $120 to that click. For recurring revenue, use the average monthly value of a new customer.
Method 2: Equivalent Advertising Cost. The Social Media Value calculator lets you see how much you’d have paid for the same exposure via paid ads. If a post generated 5,000 impressions that would cost $200 in CPM, you can credit $200 as the post’s value.
Combine both methods for a fuller picture. For example, a LinkedIn post that drove three demo bookings might be worth $600 in projected revenue, plus $150 in ad‑equivalent value, totaling $750.
Here’s a quick worksheet you can copy:
- Action (e.g., lead, sale, demo)
- Number of actions
- Average revenue per action
- Ad‑equivalent cost per action
- Total monetary value = (Revenue × actions) + (Ad cost × actions)
Pro tip: When you can’t track exact revenue, use customer lifetime value (CLV). If a typical customer brings $2,400 over three years, assign a portion of that value to the first social touch.
Pro Tip: Use SocialLead’s built‑in CLV calculator to estimate long‑term value from first‑touch leads.
Bottom line: Giving each outcome a dollar figure lets you compare social performance directly to cost.
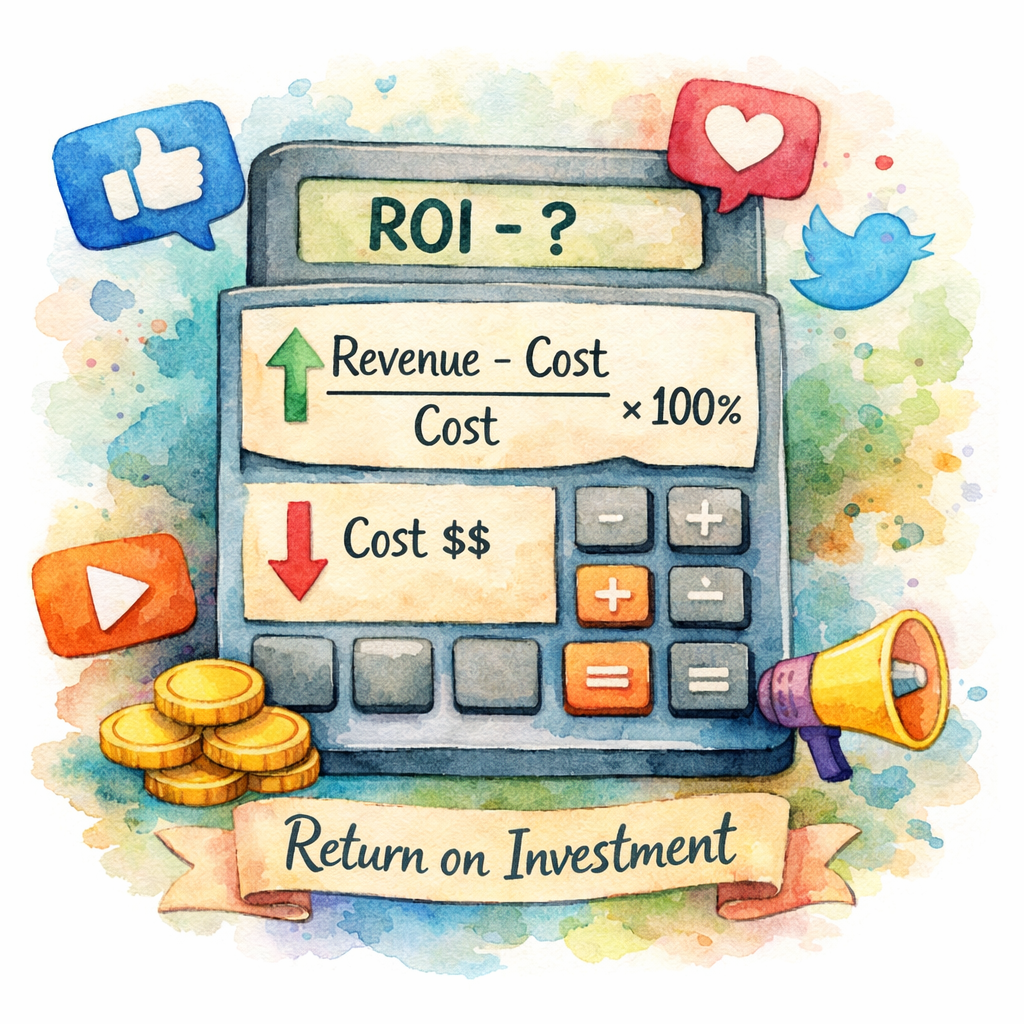
Step 4: Apply the ROI Formula
With revenue values and cost totals in hand, the math is simple. The classic ROI equation is:
ROI = (Revenue , Cost) ÷ Cost × 100
Let’s break it down:
- Revenue : total monetary value from Step 3.
- Cost : sum of ad spend, content creation fees, staff hours, and tool subscriptions.
Example: You spent $1,200 on ads, $800 on video production, and $400 on SocialLead’s subscription. Total cost = $2,400. Your tracked revenue from the campaign is $7,200. ROI = (7,200 , 2,400) ÷ 2,400 × 100 = 200%.
A 200% ROI means you earned $2 for every $1 spent. That’s a solid win for most small businesses.
When you calculate ROI for each platform, you can spot the winners. Maybe Instagram gives 150% ROI while TikTok lags at 30%, you’ll know where to shift spend.
For a deeper dive, LinkedIn’s step‑by‑step guide shows real‑world examples and common pitfalls.
Pro tip: Run the ROI formula on a rolling 30‑day window. This smooths out spikes and shows true trends.
Pro Tip: Add a “break‑even” line to your chart, when ROI crosses 0%, you’ve stopped losing money.
Bottom line: The ROI formula turns raw numbers into a clear percentage that tells you whether social is a profit center.
Step 5: Analyze Results and Optimize Campaigns
Calculating ROI is only half the story. You need to act on the insights. Start by comparing each platform’s ROI to your goal.
If a channel’s ROI is below your target, look at the underlying metrics. Low conversion may mean poor landing pages. Low engagement could signal irrelevant content.
Run a quick A/B test: swap the call‑to‑action, change the creative, or adjust the posting time. Measure the lift in the next 7‑day window and recalc ROI.
Don’t forget hidden costs. Staff time spent on back‑and‑forth comments can add up. Track hours in a simple time‑sheet and factor them into the next cost calculation.
Another powerful tweak is audience segmentation. Use SocialLead’s AI‑driven reply‑rate data to find high‑value fans (those who reply >30%). Target them with personalized offers.
When you see a platform delivering strong ROI, consider scaling spend. Conversely, pause low‑performing ads and re‑allocate budget.
Pro tip: Set up automated alerts for KPI drops. If reply‑rate falls below 15%, the alert prompts you to review content quality.
Pro Tip: Use SocialLead’s real‑time analytics to spot a sudden dip and react within hours.
Bottom line: Continuous analysis and small experiments keep your social spend growing profitably.
FAQ
What’s the simplest way to start tracking ROI?
Begin with one goal, like lead generation, from a single platform. Add UTM tags to every link, pull cost data from your ad account, and use the basic ROI formula (Revenue , Cost) ÷ Cost × 100. Once you see a clear number, expand to other goals and channels.
How do I value non‑revenue actions like comments?
Assign a proxy value based on downstream impact. If a comment often leads to a DM that converts at 5%, calculate the average sale value and multiply by the conversion rate. That gives you a dollar amount you can add to your revenue total.
What costs should I include besides ad spend?
Include content creation fees (photographer, designer), staff time (hourly rate × hours spent), tool subscriptions (SocialLead, analytics tools), and any freelance or agency fees. Missing these hidden costs inflates your ROI falsely.
How often should I recalculate ROI?
Run a fresh calculation at least once a month for a stable view. For fast‑moving campaigns, a weekly or even daily snapshot helps you catch problems early and shift budget before money is wasted.
Can I compare ROI across different campaign types?
Yes, but normalize the data first. Use the same cost categories and time frames for each campaign. Then compare the ROI percentages side by side to see which type, organic, paid, or influencer, delivers the best return.
What if my ROI is negative?
A negative ROI means you spent more than you earned. Look for high costs (perhaps video production) or low conversion rates. Cut the expensive parts, test new creatives, and re‑measure. Often a simple tweak can flip the number positive.
How do I report ROI to stakeholders?
Create a short deck with three slides: goal recap, ROI calculation (with a visual chart), and next‑step recommendations. Highlight the percentage, the dollar impact, and any budget shifts you plan. Keep it crisp, no more than 5 minutes to present.
Is there a quick tool to automate these steps?
SocialLead’s unified dashboard pulls data from nine platforms, calculates reply‑rate benchmarks, and lets you export a ready‑to‑use ROI spreadsheet. The built‑in calculators save hours of manual work.
Conclusion
Measuring social media ROI doesn’t have to be a mystery. Start with a clear, numeric goal, gather every cost and revenue line, give each outcome a dollar tag, run the simple ROI formula, and then iterate based on what the numbers tell you. The process works for a solo creator, a small agency, or a growing startup.
When you turn raw clicks into profit percentages, you earn the right to speak in dollars at budget meetings. That confidence lets you grow spend on the channels that truly move the needle.
Ready for a hands‑on experience? Explore our social media analytics dashboard guide to see how a single view can simplify the whole workflow and give you the data you need to keep improving.


